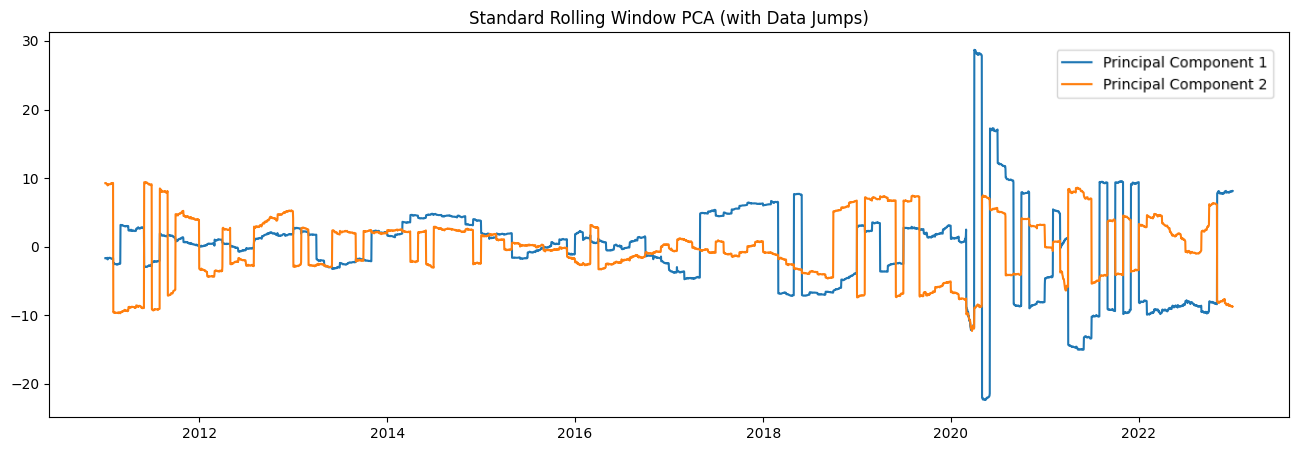
This project began during my internship, where I was tasked with improving the stability of reduced time series representations used in financial data analysis. I noticed that traditional dimensionality reduction techniques, particularly PCA, caused abrupt jumps in the transformed data over time—especially when applied to evolving, non-stationary financial signals. This inconsistency, clearly visible in the graph below, highlighted a critical issue: PCA’s assumptions often fail in time-dependent environments. Motivated to find a solution, Robust Rolling PCA (R2-PCA) is a method designed to handle temporal shifts while preserving interpretability and minimizing instability in lower-dimensional projections.
At the core of R2-PCA is the idea that temporal consistency matters when applying PCA recursively to time series data. A key issue with standard PCA in this context is eigenvector sign flipping, where the direction of principal components can arbitrarily reverse between time steps—leading to sharp, misleading jumps in projected data. R2-PCA solves this by enforcing directional consistency across time. It does so by calculating the cosine similarity between current and previous eigenvectors—since PCA produces unit vectors, this similarity is just a dot product. If a similarity score is negative (indicating a sign flip), the eigenvector is multiplied by −1 to align it with its prior orientation. Additionally, R2-PCA addresses the issue of changing principal component order over time, which arises when market forces shift the features that contribute most to variance. To resolve this, R2-PCA reorders the principal components at each time step based on the highest absolute cosine similarity to the previous period’s components. This ensures that components are matched consistently over time, both in direction and importance, allowing for stable and interpretable projections in dynamic financial environments.
In the animation above, we can see the eigenvector flipping effect for the standard PCA model. Notice the immediate effect on when the new data is projected on the flipped eigenvectors. This illustrates the importance of R2-PCA on reducing time series data; without it the dataset is nearly unusable as data appears to be randomly multiplied by -1. A further comparison of R2-PCA to another industry model can be found in the Data Visualization section.
The R2K-Means research project comes from a need to update cluster information in as rolling time series. At each step/point in time, a modified version of the K-Means algorithm is run to produce stable, updateable clusters in evolving datasets such as financial markets. Unlike standard K-Means, which suffers from random initialization sensitivity and inconsistent cluster labeling, R2K-Means carries forward centroid positions from previous time periods, enabling smooth updates when new data arrives. This approach reduces instability, preserves meaningful cluster relationships, and can naturally form non-linear decision boundaries without kernel methods—making it especially useful for dynamically modeling and tracking asset behaviors over time.
The animation above shows naïve K-Means clustering applied to a financial time series dataset, highlighting how random initialization can dramatically distort results and make them unreliable. The colored dots represent centroids calculated in a rolling window, which R2K-Means uses to form non-linear decision boundaries. While a single K-Means run at a given time produces only linear boundaries, aggregating rolling windows of K-Means clusters and projecting them to the present allows R2K-Means to capture meaningful non-linear patterns.
The animation above shows how R2K-Means performs on a time series, offering much greater stability than the naïve implementation. As the rolling window fills, it produces non-linear decision boundaries—an essential feature for datasets with irregular shapes and outliers, which are common in financial markets.
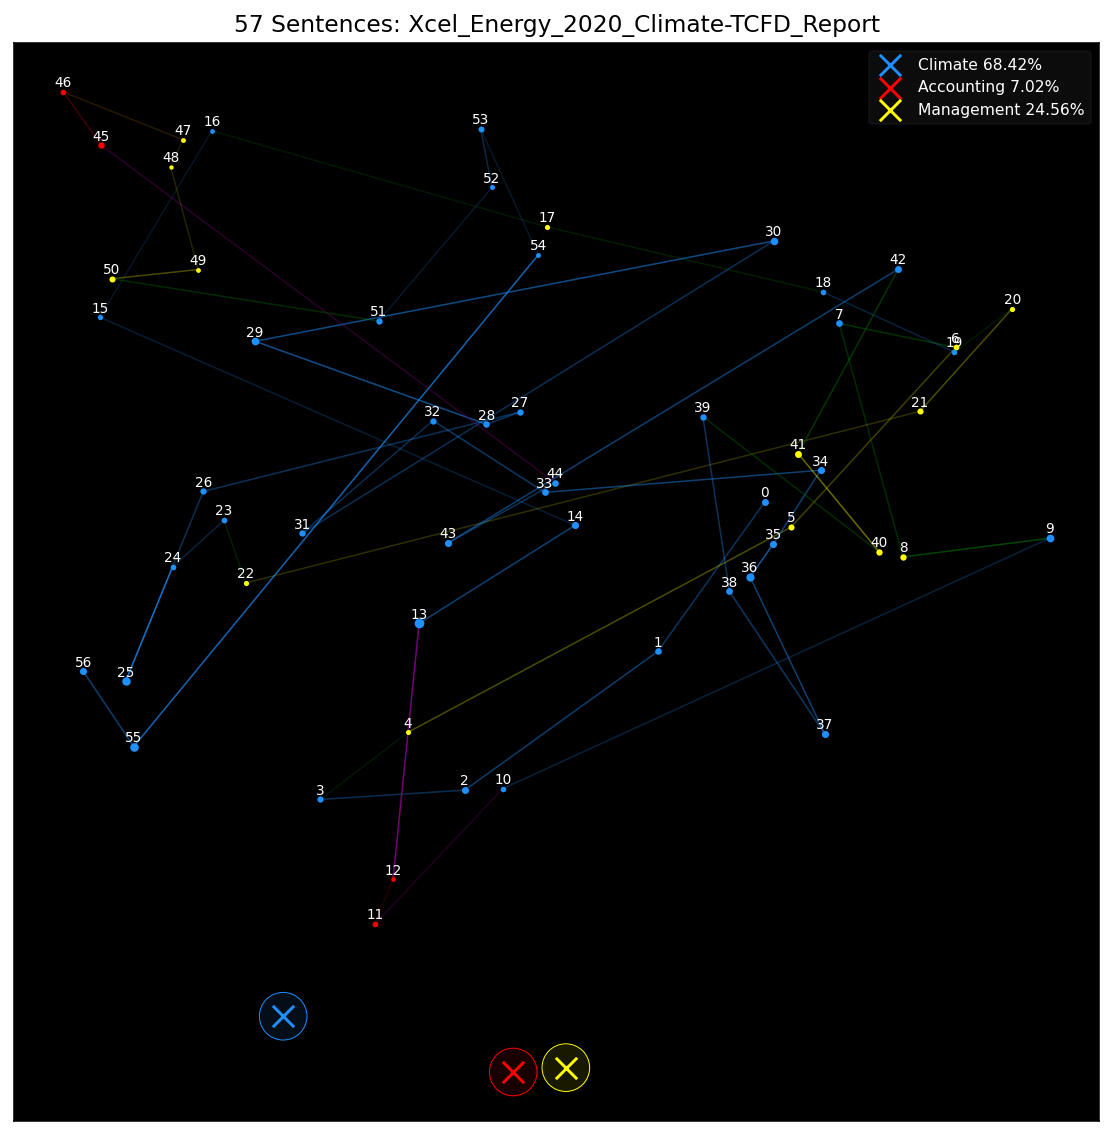
I co-developed Robust Rolling Transformer Text Classification (R2-T2C), a framework for objectively analyzing large, multi-sourced document corpora over time. R2-T2C extracts and embeds sections of each document in a rolling window, applies GPT-enhanced category generation, and uses similarity measures like cosine similarity to classify documents into user-defined categories. The framework produces rich graphs and visualizations—including t-SNE and UMAP projections—that make high-dimensional embedding data intuitive to explore. This approach supports absolute, relative, related, and trend-based assessments, making it especially valuable for evolving and inconsistent reporting landscapes such as climate finance disclosures. By combining transformer models, rolling embeddings, clustering, and clear visuals, R2-T2C delivers a scalable, unbiased way to understand how documents change, compare against guidelines, and align with peers.